From colour-changing veg to exploding cornflour, Dr Joanna Rhodes has some original ideas for practical activities around rates of reaction…
Why teach this?
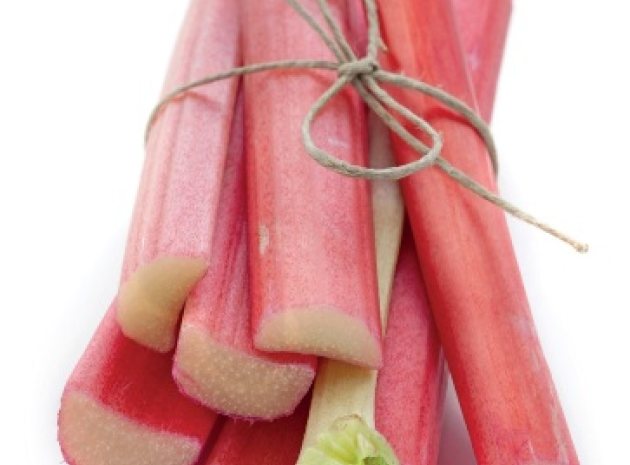
Rate of reaction provides a link between the particle model students study in physics at the start of KS4 and how a chemical reaction takes place. Students enjoy practical chemistry and rate practicals extend students’ dexterity in manipulating laboratory equipment such as gas syringes. They are also adaptable for the less well-stocked department as upturned measuring cylinders are equally as effective and cheap to provide in class sets. Data generated in rate experiments is typically reliable enough to analyse mathematically and cross-curricular links to GCSE mathematics, in particular the gradient at different points on a curve, lend themselves well to team teaching between faculties. Living in the “Rhubarb Triangle” I succumb to any opportunity to get this leafy vegetable (yes, it is considered a vegetable not a fruit) into my lessons. The rate of reaction experiment in this lesson, using rhubarb, is one of my favourites. Rate of reaction is a key concept at KS4 and requires secure knowledge for students who progress onto A-level. It is also a topic that can be taught very practically and adapted for a range of abilities and is particularly suited to extending your gifted and talented students both chemically and mathematically. Students begin by investigating the factors that can affect the rate of a chemical reaction using their own bodies and use their discoveries to suggest ways of speeding up some basic practical reactions. Links with the chemical industry could be discussed in the context of controlling reactions that may be explosively fast as well as speeding up those reactions that would cost too much because they are too slow. The topic lends itself well to demonstrations of impressive catalysis in the case of the Genie in a Bottle as well as student led discovery learning included in the sequence of practicals in the main part of the lesson. Most rate practicals can easily be adapted to generate data that can be plotted as a graph extending student mathematical understanding to include the changing gradient of a curve.
Blindfold molecules
In this activity students imagine they are molecules in a beaker. Explain to students that in order to react they must ‘collide’ with another molecule. If possible clear the furniture in the room to the sides or use an outdoor space or gym to minimize risk of injury. Blindfold a small group of students and ask them to walk around, keeping a tally on how many times they touch or bump another student in one minute. In the first variation add more students (double the number e.g. from five to ten) and get them to walk around keeping a tally for another minute. Students should record an increase in the number of ‘collisions’ and so make the link between number of molecules in a given space (i.e. concentration) and the number of reactions (proportional to rate).
- By using this model students can investigate:
- i) The effect of temperature - by asking students to move a bit faster i.e. with greater kinetic energy
- ii) The effect of a catalyst - by introducing a student who is not blindfolded and who can guide two other ‘molecules’ together
- iii) The effect of surface area by comparing the number of collisions for two groups of four students holding hands with all eight students moving independently.
After this engaging starter show the groups some sugar cubes and water and ask them to suggest different methods of increasing the rate of sugar dissolving using the principals they have learned. If you wanted to split the learning over two lessons you could ask students to complete the sugar practical using one method of their choice in groups. Provide beakers, measuring cylinders, thermometers, Bunsen burners, beakers, tripods and gauzes and pestles and mortars and watch as your students increase temperature, concentration and surface area to help their sugar cubes to dissolve.
Main Activities
1 – Rapid rhubarb
In this experiment, rhubarb sticks, which contain oxalic acid, are used to reduce and consequently decolourise potassium manganate(VII) solution. The experiment can be used to show how the rate of reaction is affected by surface area or concentration and is available from the Nuffield Foundation [Additional Resource 1], which contains health and safety guidance especially cautioning against the use of rhubarb leaves, which contain too much oxalic acid and are harmful. To investigate the effect of surface area cut three 5cm lengths of rhubarb. Leave one complete and divide the others into two and four pieces respectively. Place the pieces into a beaker containing 50cm3 of acidified potassium manganate (VII) and start the timer. Once the purple colour disappears stop the timer. This can be repeated for each set of rhubarb pieces and more able students may be able to identify the number of pieces as the independent variable and the time taken as the dependent variable in order to plot a graph of the relationship. To investigate the effect of concentration make an extract of rhubarb by boiling in a beaker until the rhubarb falls to pieces. Allow it to cool and strain and filter the mixture keeping the solution you have extracted. Then conduct a similar reaction to the first experiment, initially adding one drop of the extract to 50cm3 of the potassium manganate (VII) solution and timing how long it takes to decolorise. Repeat for 2, 3, 4 and 5 drops plotting a graph of the results. The concentration of the potassium manganate (VII) solution is not critical for these experiments; it can be made by dissolving a few crystals in 1 M sulfuric acid, giving a light purple colour. By carrying out these experiments students should be able to observe that as the surface area or concentration of the rhubarb increases, so does the rate of the reaction. Higher ability students may observe (or be prompted) that putting in more drops of the rhubarb extract has increased the total volume. You may then like to discuss the implications of this with the students. If the drop volume is small enough compared to the total volume it should not have a significant effect on the relationship observed.
2- Genie in a bottle
In this experiment the decomposition of hydrogen peroxide into water and oxygen is catalysed by the addition of manganese (IV) oxide leading to a rapid release of oxygen and steam, which appears dramatically like a genie out of a bottle if a conical flask is used [AR2]. The demonstration with 100vol hydrogen peroxide is safest carried out by a teacher, however students can investigate the catalysis with lower concentrations of peroxide using a gas syringe or upturned measuring cylinder to collect the gas evolved as the mass of catalyst is changed as described on a superb worksheet produced by Leicester Grammar School [AR3]. Other substances will also catalyse the decomposition of peroxide; an interesting alternative is to investigate the best catalyst by measuring how much gas is evolved for each in one minute. Suggestions, some of which develop links with biology, include liver or blood [AR5], iron (III) oxide and potassium iodide. For other examples consult the helpful practical procedure from the Royal Society of Chemistry [AR4].
In and out of control
Perform a demonstration of a custard/cornflower explosion [AR6] to the class to illustrate the way that surface area can be large enough to trigger and explosive reaction. As a contrast, model the formation of lab-grown stalagmites [AR7] using a saturated solution of sodium ethanoate falling drop by drop from a burette onto a white tile (it helps to set this up about 20 minutes before the lesson so a small ‘stalagmite’ has already begun to form). Ask students to suggest why it might be important to control rates of reaction in the chemical industry. Now play the catchy rate of reaction song written by Mark Rosengarten [AR8] and ask students to make a list of five factors that an engineer could use to speed up a reaction and five factors that an engineer could use to slow down a chemical reaction. Challenge them to come up with their own song, poem or mnemonic to remember these factors!
Graphs and Gradients
A rate of reaction practical lends itself well to practising cross-curricular mathematical skills. Introduce students to the concept that rate is amount of product formed divided by time and so the gradient of a concentration against time graph, or mass lost against time (if the reaction produces a gas) is equal to the rate. Students can then be asked to describe how the rate changes as a reaction proceeds by looking at the change in gradient (steep initial gradient, leveling out and eventually stopping completely). Help students to make the connection between this and the change in concentration of reactants as the reaction proceeds. A useful activity to check their understanding could be to interpret a set of concentration/time curves to compare the rates of different chemical reactions. For your highest ability students you could look for the description in prose and to support other student to access the same material you could scaffold the activity with a multiple choice exercise asking them to select the reaction with the highest initial rate from three examples or the reaction which takes the longest to stop altogether. A key piece of knowledge that is often tested at KS4 is whether students recognize that speeding the reaction up with a catalyst or higher temperature does not increase the amount of product formed just the speed the reaction reaches completion. Superb examples are available on the BBC Bitesize website [AR9].
Collision theory
Underpinning the factors that affect rate of reaction is collision theory. In order to react particles must collide with each other with sufficient energy and in the correct orientation. This is similar to the model used for the starter activity Blindfold Molecules. Ask students to explain, using collision theory, why each of the factors they have listed during the lesson affect rate of reaction. It is helpful to provide an example such as “If I increase the concentration, the number of particles increases so the frequency of successful collisions increases and the rate increases”. From here students can modify their answers for each factor including concentration, temperature, pressure (gases) and surface area. Catalysts speed chemical reactions up in a different way by providing an alternative route for the reaction to take place with a lower activation energy. By asking students to use this information to sketch an energy profile diagram for a reaction with and without a catalyst you can revise or introduce energy changes in reactions.
Additional Resources
- [1] Rates and Rhubarb tinyurl.com/tsrates1
- [2] Genie in a Bottle tinyurl.com/tsrates2
- [3] Using a gas syringe to investigate the decomposition of hydrogen peroxide tinyurl.com/tsrates3
- [4] Catalyst Examples and Practical procedure from the RSC tinyurl.com/tsrates4
- [5] Catalysis of decomposition of hydrogen peroxide tinyurl.com/tsrates5
- [6] Cornflour Bomb tinyurl.com/tsrates6
- [7] Sodium ethanoate stalagmite tinyurl.com/tsrates7
- [8] Mark Rosengarten “Rates of Reaction” tinyurl.com/tsrates8
- [9] BBC Bitesize rates and graphs tinyurl.com/tsrates9


