Many students will know how to calculate the mean: they add up all the numbers and divide by how many there are. However, it is common to find that students are less sure about exactly what the value that they have calculated actually means. Students may not understand that the mean tells us how much we get if we share out the total evenly. They may not appreciate that when the data contains repeated numbers the mean is weighted according to the relative proportions of the different numbers within the whole data set. Having a robust understanding of the meaning of the mean helps students to make sense of the values that they calculate. It may also enable them to find more efficient ways to calculate the mean when there are patterns in the data, and this prepares the way for calculating the mean from a frequency table.
WHY TEACH THIS?
Sometimes students carry out statistical calculations without much sense of what the answers mean or whether they are even of a sensible size. This lesson helps to make sense of the meaning of the mean as well as exploring efficient ways to calculate it.
STARTER ACTIVITY
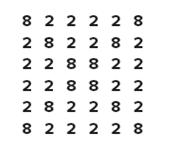
Q. What patterns do you see in this grid of numbers?

Students might comment that there are only two different numbers: 8 and 2, that the 8s lie along the diagonals and the 2s are everywhere else. They might pick out four 2×2 squares of 2s and one 2×2 square of 8s. Encourage students to say whatever they notice – the purpose is to get them to look carefully at the grid as well as to develop their ability to communicate mathematically.
Q. Which are there more of: 8s or 2s?
Students might start pointing in the air and counting and you could either ignore this or ask:
Q. Can you work it out without counting them all?
or:
Q. Can you work out how many 2s and 8s there are without counting them all individually?
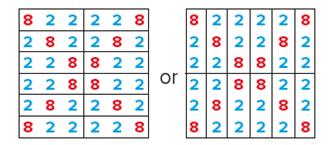
There are twice as many 2s as 8s. One way to see this is to put a box around 12 triples, each containing two 2s and an 8; for example,

Altogether there are 24 2s and 12 8s. Students might note that there are 3 8s in each quarter of the square, making 12 8s altogether, and 36 numbers in the entire 6 × 6 square so there must be 36 – 12 = 24 2s. See what other ways students can invent to count the numbers quickly.
MAIN ACTIVITIES
Q. What do we mean by the mean?
Students will probably say that to find the mean you add up all the numbers and divide by how many there are. The mean tells us what we get if we share out the total evenly. They might say that it is “the average”, but there is more than one definition of “average”.
Q. What is the mean of all the numbers in the grid? How do you know?
Students could discuss this in pairs before offering answers and explaining how they did it. You could notice whether they feel the need to use calculators – or ask them not to, if you prefer. It is very tedious to calculate:
8 + 2 + 2 + 2 + 2 + 8
+ 2 + 8 + 2 + 2 + 8 + 2
+ 2 + 2 + 8 + 8 + 2 + 2
+ 2 + 2 + 8 + 8 + 2 + 2
+ 2 + 8 + 2 + 2 + 8 + 2
+ 8 + 2 + 2 + 2 + 2 + 8 = 144
and then work out 144 ÷ 36 = 4. A quicker way is to count up the 2s and the 8s separately and then work out 24x2+12x8/36=4 . (An even easier way is to spot the repeating pattern of 2 2s and an 8 and work out 2x2+1x8/3=4 .)
Students might expect the mean to be 5, because the mean of 2 and 8 is 5, but because there are twice as many 2s as 8s the mean is weighted towards the 2s, so it is nearer to 2 than it is to 8. If they don’t yet notice or understand this, they will have further opportunity to think about it during the rest of the lesson.
Q. What is the mean of the numbers in this grid?
5 1 1 5
1 1 1 1
1 1 1 1
5 1 1 5
Students should be able to calculate 12x1+4x5/16=2 . (Did they find a quick way to see that there are 4 5s and 12 1s?) Again the mean is less than 1+5/2=3 because there are more 1s than 5s.
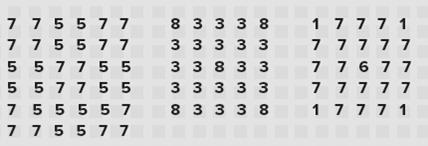
Q. What about these? Can you work out the mean of the numbers in each grid?

A task sheet containing all of these number grids is available at http://www.teachsecondary.com/downloads/maths-resources
For the first one, once students have realised that there are equal numbers of 5 and 7 they can give the answer 6 immediately, without having to do any calculations at all! For the second one, mean = 20x3+5x8/25=4 , and, for the third one (the first one to contain three different numbers), mean = 4x1+1x6+20x7/25= 6.
Q. The mean doesn’t always have to be an integer, but in all of these cases it has been. Make up some number grids of your own that also have an integer mean.
Students will realise that it is harder than they might have thought to get an integer answer. The total of the numbers in the grid must be a multiple of the grid size. When they have constructed their grids they could swap them and work out the mean of each other’s grids.
DISCUSSION
You could conclude the lesson with a plenary in which the students talk about the grids that they have created and how they worked out each other’s means. If you have a visualiser in the classroom, it would be easy to display different students’ grids on the board; otherwise you may need to ask some students to copy them out onto poster paper or onto the board in advance of the discussion.
Q. What is the mean for this grid? What different ways are there of calculating the mean? Which method do you find quicker/ easier? Why? Can anyone see another way of doing it?
If students need further challenges you could ask questions like:
Q. How could I change this grid to make the mean equal to 10? Could I change just one number to make the mean equal to 10?
You could then show a frequency table such as this:

Q. What might the grid look like that goes with this table?
There are many possibilities for a 5 × 5 grid with 16 5s, 2 7s and 7 8s.
Q. The frequency shows the number of times that each number appears. Can you work out the mean without looking at the grid?
Without being told to, students should see that they need to multiply each value by its frequency. For example, in the first row 5 × 16 = 80, which is “the total of all the fives”. So the total of all the numbers is 150 and the number of values in the grid is 25, so the mean must be 150/25 = 6.
If anyone is stuck, ask them to go back to the grid that they drew and work out the mean from that, which should help them to see the meaning of the numbers in the table. Students could create frequency tables for some of the other grids they used in this lesson or for others of their choosing.
STRETCH THEM FURTHER
Students could try to create a frequency table that produces an integer mean. this is quite hard and you could make it more challenging by asking students to use particular values (e.g., 4, 7 and 9) with non-zero frequencies.
KEY RESOURCE
Integral A level mathematics and further mathematics resources cover AQA, Edexcel, OCR, OCR(MEI) and WJEC. As well as notes, exercises, online tests and interactive resources, Integral contains many resources to facilitate classroom discussion and group work such as mathematical jigsaws with expressions or properties to match up. From 2015/16 Integral will contain ‘learning walkthroughs’ - sequences of activities which students can work through to meet, explore or revise topics.
Visit integralmaths.org for samples or book at bit.ly/1PnnGqV to join an online webinar about Integral, which is developed by Mathematics in Education and Industry, an independent charity committed to improving maths education.
ABOUT OUR EXPERT
Colin Foster is an Assistant Professor in mathematics education in the School of Education at the University of Nottingham. He has written many books and articles for mathematics teachers (foster77.co.uk)


