Flowcharts can be a great way to explore and make sense of mathematics, says Colin Foster…
Why teach this?
Flowcharts are a convenient way of representing a sequence of operations diagrammatically. Their flexibility means that they can be readily adapted to different situations; allowing learners to increase their understanding of subjects across the curriculum as they vary the operations and investigate the effects that result…
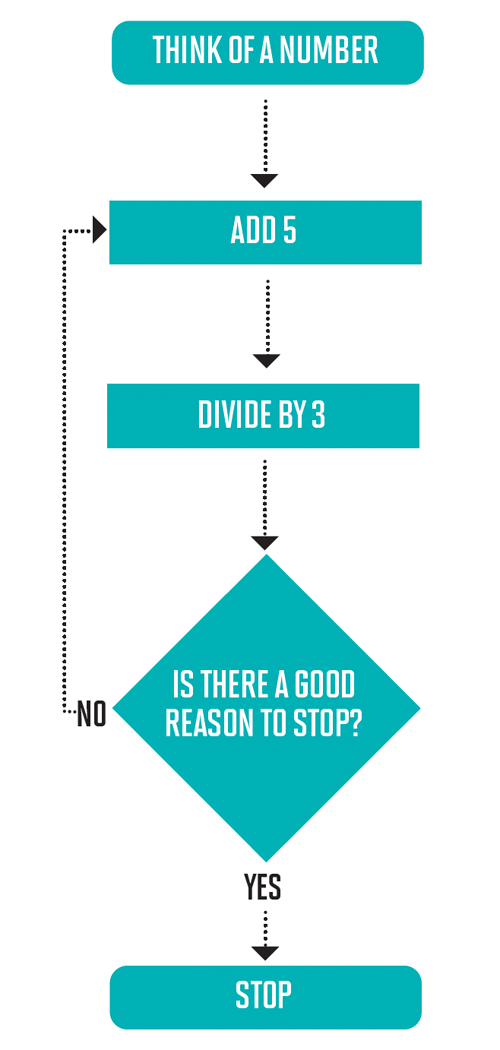
Flowcharts are a highly visual way of communicating information and are used in this lesson to set up rules about operations that will be performed iteratively. An iterative mathematical process consists of a cycle of operations that is carried out repeatedly. They can be hard to explain in words, but a flowchart showing what is happening is quick for students to comprehend. In this lesson, KS4 students are invited to explore what happens when they put different numbers into a given flowchart, and later to experiment with varying the features of the flowchart themselves. They will encounter some converging sequences and use algebra to predict and explain the outcomes. Although the operations used in the flowcharts in this lesson are simple, the fact that they occur repeatedly makes the analysis challenging. Linear equations provide a good way of making sense of what is going on and enable students to design their own flowchart that, regardless of the initial input, will produce a string of numbers that converge to any value of their choice. Being able to exercise complete control like this over an iterative mathematical process is a potent way of helping students to appreciate the power of mathematics.
Starter activity
Q. I would like you to try out this flow chart and see what happens with different numbers.

Give students a little while to experiment with the flowchart. If they ask what is meant by ‘a good reason’, just say that it is up to them to decide. Issues of ‘convergence’ will arise during the subsequent discussion.
When students have had some time to explore, have a discussion about what they have found. Q. What numbers did you try? Why? What happened? What made you stop? Do you have any conjectures? What mathematical questions can you ask about this? Students will notice that, whatever numbers they start with, by going around the flowchart enough times they will eventually end up with numbers that get as close as they like (the technical term is arbitrarily close) to 2.5. We say that the numbers obtained converge to 2.5.
Download a printable, a4 version of this flowchart.
Main activities
Q Now I want you to change some of the details in the flowchart and see what effect this has on the numbers that come out. Ask your own questions and see what you can find out.
If students are short of questions to ask, you could collect ideas together on the board – even if these are not fully-formed questions – and then collectively try to improve them. It doesn’t matter if not every student can think of a good question. Once a reasonable list of questions are on the board students can choose a question to pursue. Sometimes better questions emerge once students get a bit further into the task.
Here are some possible questions that students could ask:
- What happens if I change the +5 step to -5 instead?
- What happens if I change the +5 step to +2 or plus-something-else?
- What happens if I multiply by 3 instead of divide by 3?
- What happens if I divide by 5 instead of by 3 or divide by some other number?
- What if I replace ‘divide by 3’ with ‘square root’? Or ‘cube root’?
- What happens if I restrict the numbers I begin with; for example, if I begin with negative numbers or numers greater than 1000?
- Does the flowchart process always converge no matter what number I start with? How can I be sure?
- Does the flowchart process still converge if I change the operations?
- When does the flowchart process converge quickly and when does it converge more slowly?
- Can I design a flowchart that will converge to any number of my choosing, such as 17.2 or -6? No stuent will have time to work on all of these questions. It is probably more useful for them to focus on just one or two questions and try to get as far as possible with those rather than flitting from question to question. Students will be able to get a long way with just a calculator, but if they have access to spreadsheets, and know how to write a simple formula, that will save them a lot of time and allow them to focus more on the bigger picture. For example, to carry out the process in the original flowchart using a spreadsheet, put the starting number in cell A1 and then in cell A2 put the formula
=(A1+5)/3
and copy this formula down column A for quite a few rows. Then students can alter the number in A1 and see what effect this has on the subsequent numbers.
Summary
You could conclude the lesson with a plenary in which the students talk about what they have found out. In general, with ‘Add a’ and ‘Divide by b’, the sequence will converge to
if [b] > 1.
This is why in our original example with a = 5 and b = 3 the sequence converged to 5/2 = 2.5. If b<1 , the sequence will diverge, meaning that the values will not get arbitrarily close to any fixed number, no matter how many iterations are carried out. Generally, the closer the starting number is to the limit (the number that the sequence converges to), the more quickly the sequence will converge. One way to make quantitative comparisons is to ask how many steps it takes until the numbers don’t change in the first, say, 3 decimal places. In the original flowchart, 2.5 is the limit, because it has the special property that if you start with 2.5 it doesn’t change. This happens because (2.5 + 5)/3 = 2.5, and this is the only number with this property. This means that the flowchart effectively finds the solution to the equation (x + 5)/3 = x. Once students realise this, they can begin to predict algebraically, by solving these linear equations, what value a given flowchart will converge to and design flowcharts that will converge to any desired value, regardless of the starting number.
Additional resources
A more complicated flowchart to explore is given at http://nrich.maths.org/5918, and in the book flowchart investigations (mathematical association, 2012) I provide 20 flowcharts that are intended to provoke rich, purposeful mathematics. (see www.m-a.org.uk/jsp/index.jsp?lnk=913 for further details.)
Stretch them further
Can students use a graph to represent what is happening in one of these flowcharts? For example, they could draw the lines y = x and y = ( x + 5)/3 and generate a staircase (or cobweb) diagram showing how, starting with any initial input number, the numbers generated bounce between these lines, eventually arriving at the point where the two lines intersect
About our expert
Colin Foster is a Senior Research Fellow in mathematics education in the School of Education at the University of Nottingham. He has written many books and articles for mathematics teachers (see www.foster77.co.uk).
For a huge selection of free maths lesson plans for KS3 and KS4 click here.


Flowcharts can be a great way to explore and make sense of mathematics, says Colin Foster…